A significant feature on fishing maps today is depth measurement or contour lines. Reading and understanding contour lines are the two most important skills for finding fish. Depending on the size and scale of the map, contour lines can represent 2-foot intervals all the way up to 40-foot intervals. A series of closely spaced lines represents a sharp drop-off, while widely spread lines represent a gradual slope.
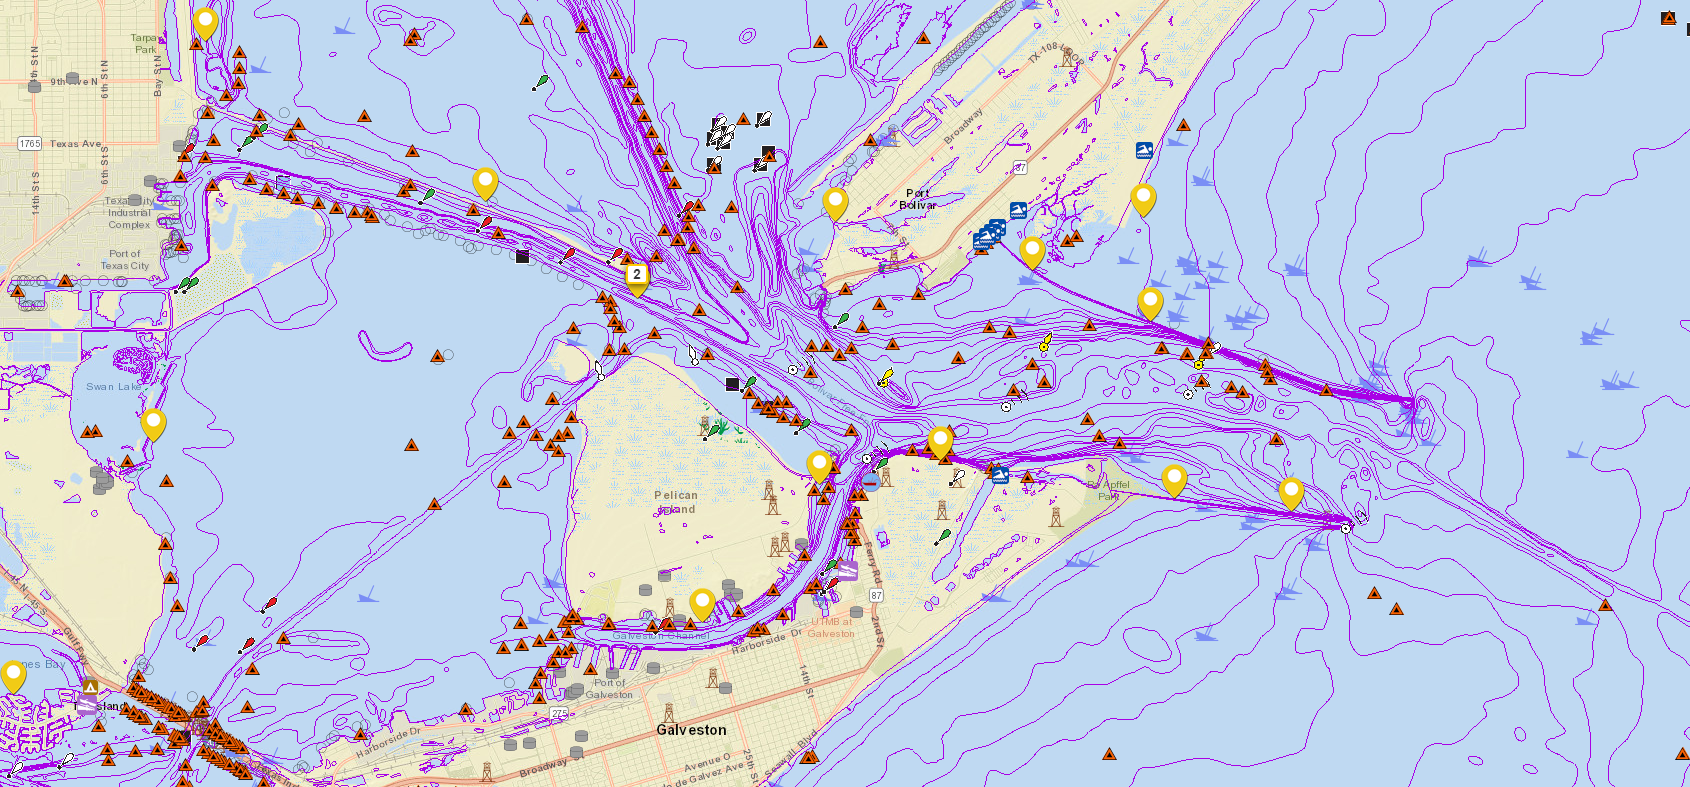
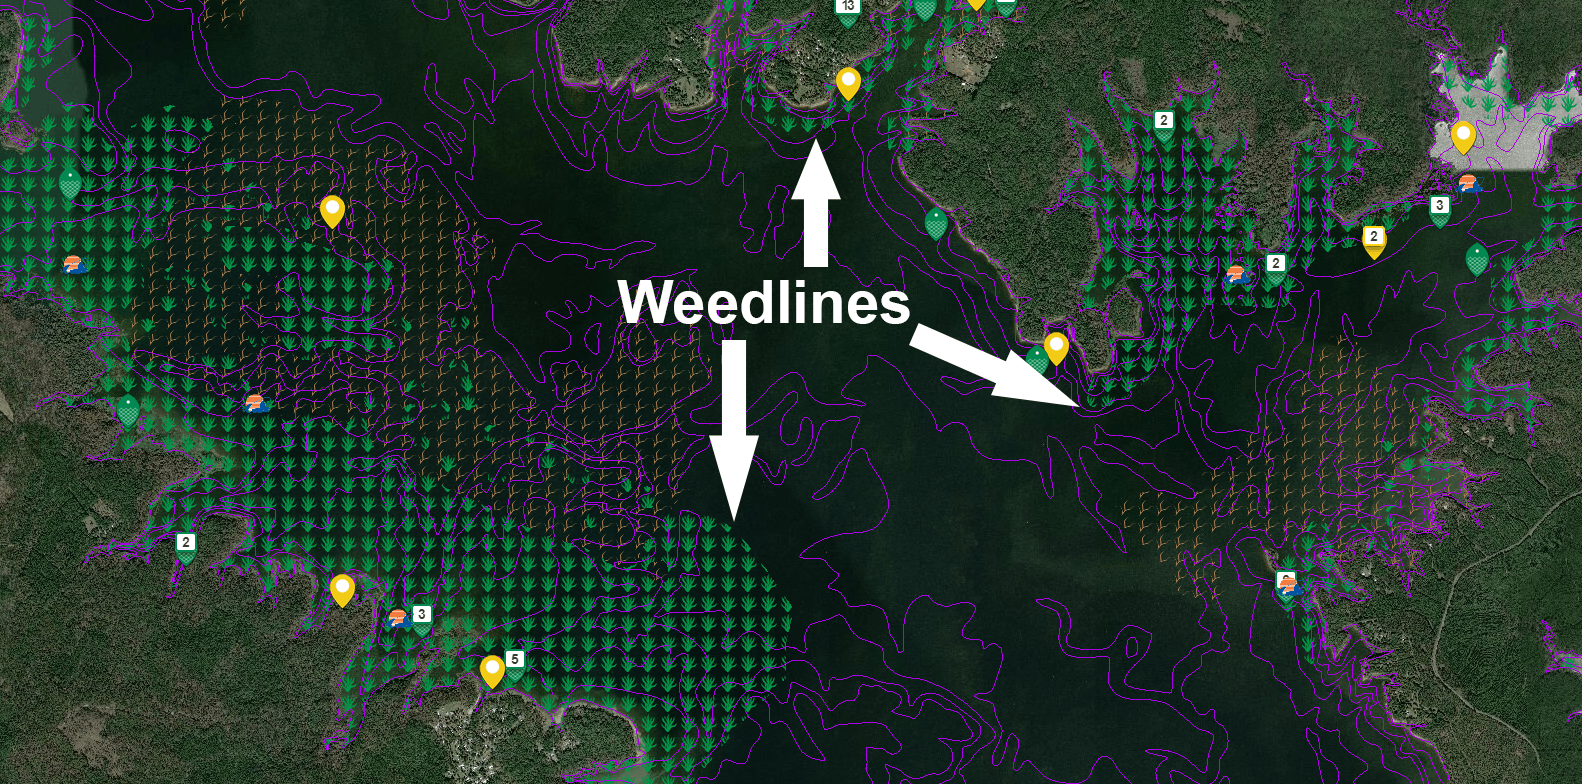
Contour or hydrographic maps show edges. An edge is the end of some type of structure or cover, such as a weedline, brushline or the borders of an old river channel. Edges attract gamefish because edges are major feeding areas. Knowing where edges exist will put you in direct contact with fish.
Fishermen often use the term “breakline” to describe a distinct increase in depth. Breaklines can be located by studying fishing maps. The term is also used to denote areas where there are definite changes in the other characteristics such as water clarity, temperature and oxygen content.
Transition zones are where bottom changes from one material to another. An example of a transition would be tapering sand-flat ending in a bottom that is solid rock. Fish relate closely to the zone where the materials change. Carefully reading the map will help you find these breaklines and transition zones in the bodies of water you fish.
Check out the depth contours on Fishidy’s fishing maps. We have more than 4,000 waterways covered from coast-to-coast. Want to take our maps on the water? Use the Fishidy app for mobile access to all of our maps, Fishing Hot Spots® data and catch information on waterways in your area.


